The end of the year will be here before we know it, and with it brings the dreaded year-end reporting for driver risk professionals.
But with the right technology, you can virtually eliminate the endless CSVs and late nights that haunt this annual tradition. SambaSafety offers a variety of benefits for risk professionals looking to improve their year-end driver risk analysis reporting process, including:
- Putting your MVR, crash and claims data behind a “single pane of glass”
- Offering intuitive tools to find the exact answers you need
- Making it simple to grab and share appealing, organized and insightful visuals
Keep reading to learn how you can make your year-end driver risk reporting process quicker and easier.
Getting Started with Annual Reporting
The beauty of our innovative solution is the ability to start at the proverbial “50,000-foot view” and drill down into the details – pairing well with your annual reporting. Here’s a simple outline you can use to organize your annual driver report, taking a top-down approach.
How Much Driver Risk Do I Have?
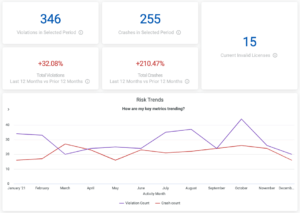
At a glance, our sample company here is having a very bad year from a risk perspective. Driver violations are up 32% and crashes are up 210%.
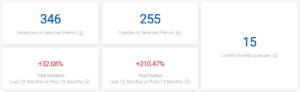
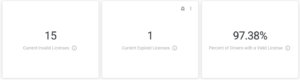
Here’s a silver lining: they have about 97.4% of their total population with a valid driver’s license, which is actually better than the 2021 SambaSafety benchmark of 96.7%.
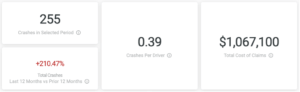
However, the crash costs have run into the six digits for this hypothetical company.
What Behavior is Causing Driver Risk?
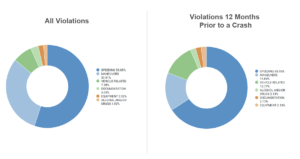
The next obvious thing to ask is: what behavior has been causing risk over the past year? With SambaSafety, you can quickly drill into the violations dashboard and look at the types of violations.
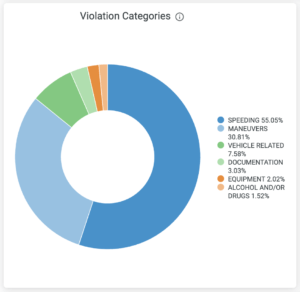
Speeding is a straightforward problem. And as a leading indicator of crashes, you’ll see shortly that it’s high up on the list. But “Maneuvers” as a violation category covers a lot of sins. What specific problems does our safety director need to focus on in 2022? Let’s look more closely.
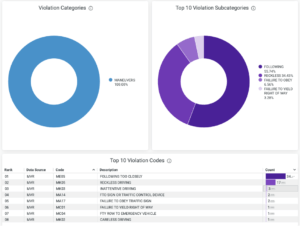
Most troopers will tell you that getting pinched for “following too closely” is not because a driver was suddenly cut off. It usually belies tailgating and road rage. The data for this company points at a driver population that’s prone to aggressive driving. This gives our risk professional a specific safety initiative for 2022, with the hard data to back it up!
What Areas of My Organization Need Intervention?
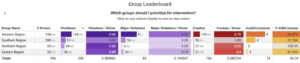
Some parts of your organization may be performing better or worse than others. Our solution lets you look at leaderboards based on the groups with the most violations, crashes or percentage of invalid licenses.
Take a look at the “Western Region.” We know the Western Region is pretty large in terms of drivers, right? But it’s not the largest. Yet it’s where we are facing the most risk, both in terms of raw numbers and the rate per driver.
With SambaSafety, you can dig a little deeper into the numbers to identify the problems and figure out an intervention. You can also filter by types of driver violations to help focus your intervention efforts. In the example below, we’ve filtered by speeding.
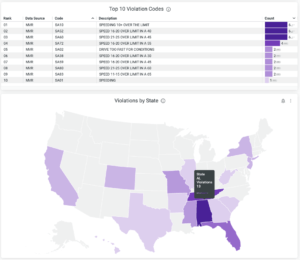
By looking at the speeding violations, we discovered that the Western Region’s problems are on the far side of the country. Perhaps they’re a trucking company with a major distribution center there, and the drivers feel pressured to “make up time” near the end of their run. Whatever the case, it merits investigation by the safety team.
What are the Leading Indicators of Crashes?
The table below showcases the results of a study recently conducted at SambaSafety analyzing decades of driver data. From this study, it’s clear that violations (and crashes) are the best way to predict future crashes. For example, if a driver receives a violation for failing to signal a lane change, it increases the likelihood of a crash within the next 12 months by almost 113%!
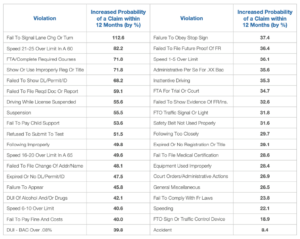
Free Download | Explore the Complete Crash Prediction Study
And while our leading indicator study is a good starting place, you should also look at your company’s unique leading indicators. Maybe you don’t get many “failure to obey a sign” tickets because your vehicles have more freeway routes than urban routes. Maybe you test for drugs regularly, thus reducing your DUI incidents.
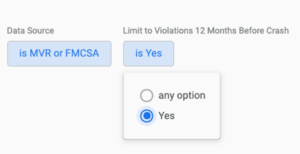
When this company looks at only those violations in the 12 months prior to crashes, we can see an outsized impact of speeding: from 55% to 66%. Maybe it’s time to look at adjusting the company’s disciplinary actions on speeding. Or better yet, to emphasize it during regular fleet training.
Are We Getting Better or Worse?
Obviously, the Company Insights dashboard paints an unflattering picture for this company.
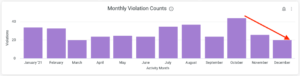
But when our doomed safety manager pops into the Violations Insight page, he sees a glimmer of hope: a positive downward trend in violations counts during the fourth quarter!
Don’t Confuse Bureaucratic Lag with Improvement
Here’s a critical piece of advice: don’t fall into the trap of telling your boss that you’re on a positive trend just by looking at raw counts. Last quarter’s MVR data is always in flux.
We call this “bureaucratic lag”.
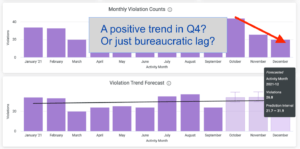
Bureaucratic lag describes the delay in violations count as tickets wend their way through the legal system. For example, a driver is pulled over in December, tries to fight the ticket in February and is ruled against in March. As soon as it’s adjudicated* in March, it will hit your report. But it changes your December number.
* Monitoring nerd point: we often get the data from courts instead of the DMV to keep your costs low.
To combat bureaucratic lag, our solution uses machine learning and your past three years of data to forecast the past three months of violations.
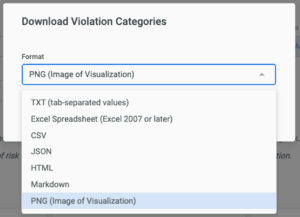
Grab Gorgeous Graphics for Your Report or Presentation
Building up your annual report is incredibly simple. Any visualization can be downloaded in multiple ways. You can get the raw data, of course, but you can simply download a graphic — literally any graphic — to drop into a presentation or report.
Ready to Elevate Your Approach to Driver Risk Management and Improve Safety Across Your Entire Driver Population?
Download this guide to learn how a comprehensive approach can help paint a clearer picture of your driver risk.