
Questions are Easy, but Answers are Harder
Every day, risk professionals in HR, operations, insurance and legal ask themselves tough questions that have real impact on the business.
- Who in my fleet is putting us most at risk?
- Where should I focus my safety efforts?
- What are our most common violations?
- What are the unique risks we face from different company groups or locations?
- Are we facing more or less risk than last year? Last quarter?
- Is what we’re doing actually working?
Data is Everywhere, but Hard to Use
And despite 2022 being right around the corner, the answers are hard to find. Not because the data isn’t there, but because the data is everywhere. You pull claims data from one system, violations data from another, training data from a disconnected LMS.
Then, clients tell us, you and your team cobble it all together with spreadsheets and Tableau databases. Several companies said it takes 30+ hours each month to build reports. Worse, none are particularly actionable because they’re now disconnected from the original systems. And the whole time they’re secretly worried about the cleanliness and accuracy of the data.
The problem isn’t the lack of data. It’s the fact that it’s all over the place. It’s like walking into a teenager’s room with clothes littering the floor, and hearing them complain they have nothing to wear. (No, that’s just our kid?)
Stop Telling Yourself Data is Only for Big Companies
Or worse, you don’t do any of that. Risk professionals at smaller companies tell us they’ve stopped looking for answers to those questions. They don’t have the time or resources. And when their next insurance renewal comes around, they are fighting blind.
An Easy Way to Get More from Your Data
Insight is a dynamic new reporting feature that helps you make sense of all your driver data including: MVR & CSA violations, crash claims and license status. In a few clicks you can:
- Uncover violation trends — and decide where to focus your safety efforts
- Identify problem drivers — then immediately enroll them in relevant safety training
- Evaluate your safety campaigns — and share positive results with your insurance broker
For curious-minded risk professionals, it’s a dream: you can spot issues at a high level, then drill down to get a more detailed understanding of the behavior that’s driving risk. And best of all, you can take action by assigning training to fix those problems. It gives you answers to impactful business questions.
So let’s take a look at some of the most common questions risk professionals ask, and see how Insight makes them so simple to answer.
Get the 10,000-foot View of Fleet Risk
“Where should I focus my safety efforts?”

The company insight dashboard provides a quick overview of the major components of risk, while letting you quickly dive into the details.
For example, if your violations are trending upward, you know you want to take action. But what kind of action? Insight makes it easy to dig a little deeper to see if those upward trends are across the board, focused in geographic area or business unit, or if they’re grouped together in a particular type of violation. The beauty of Insight is that pretty much everything is clickable to take you a level deeper.
The dashboard, like all the reports and graphs in Insight, gives you a ton of filters: groups, dates, states, violation types. If you have a mixed fleet, you can show MVRs or CSA data. The trendlines default to 12 months, but you can go shorter or longer. All your SambaSafety data is available to you.
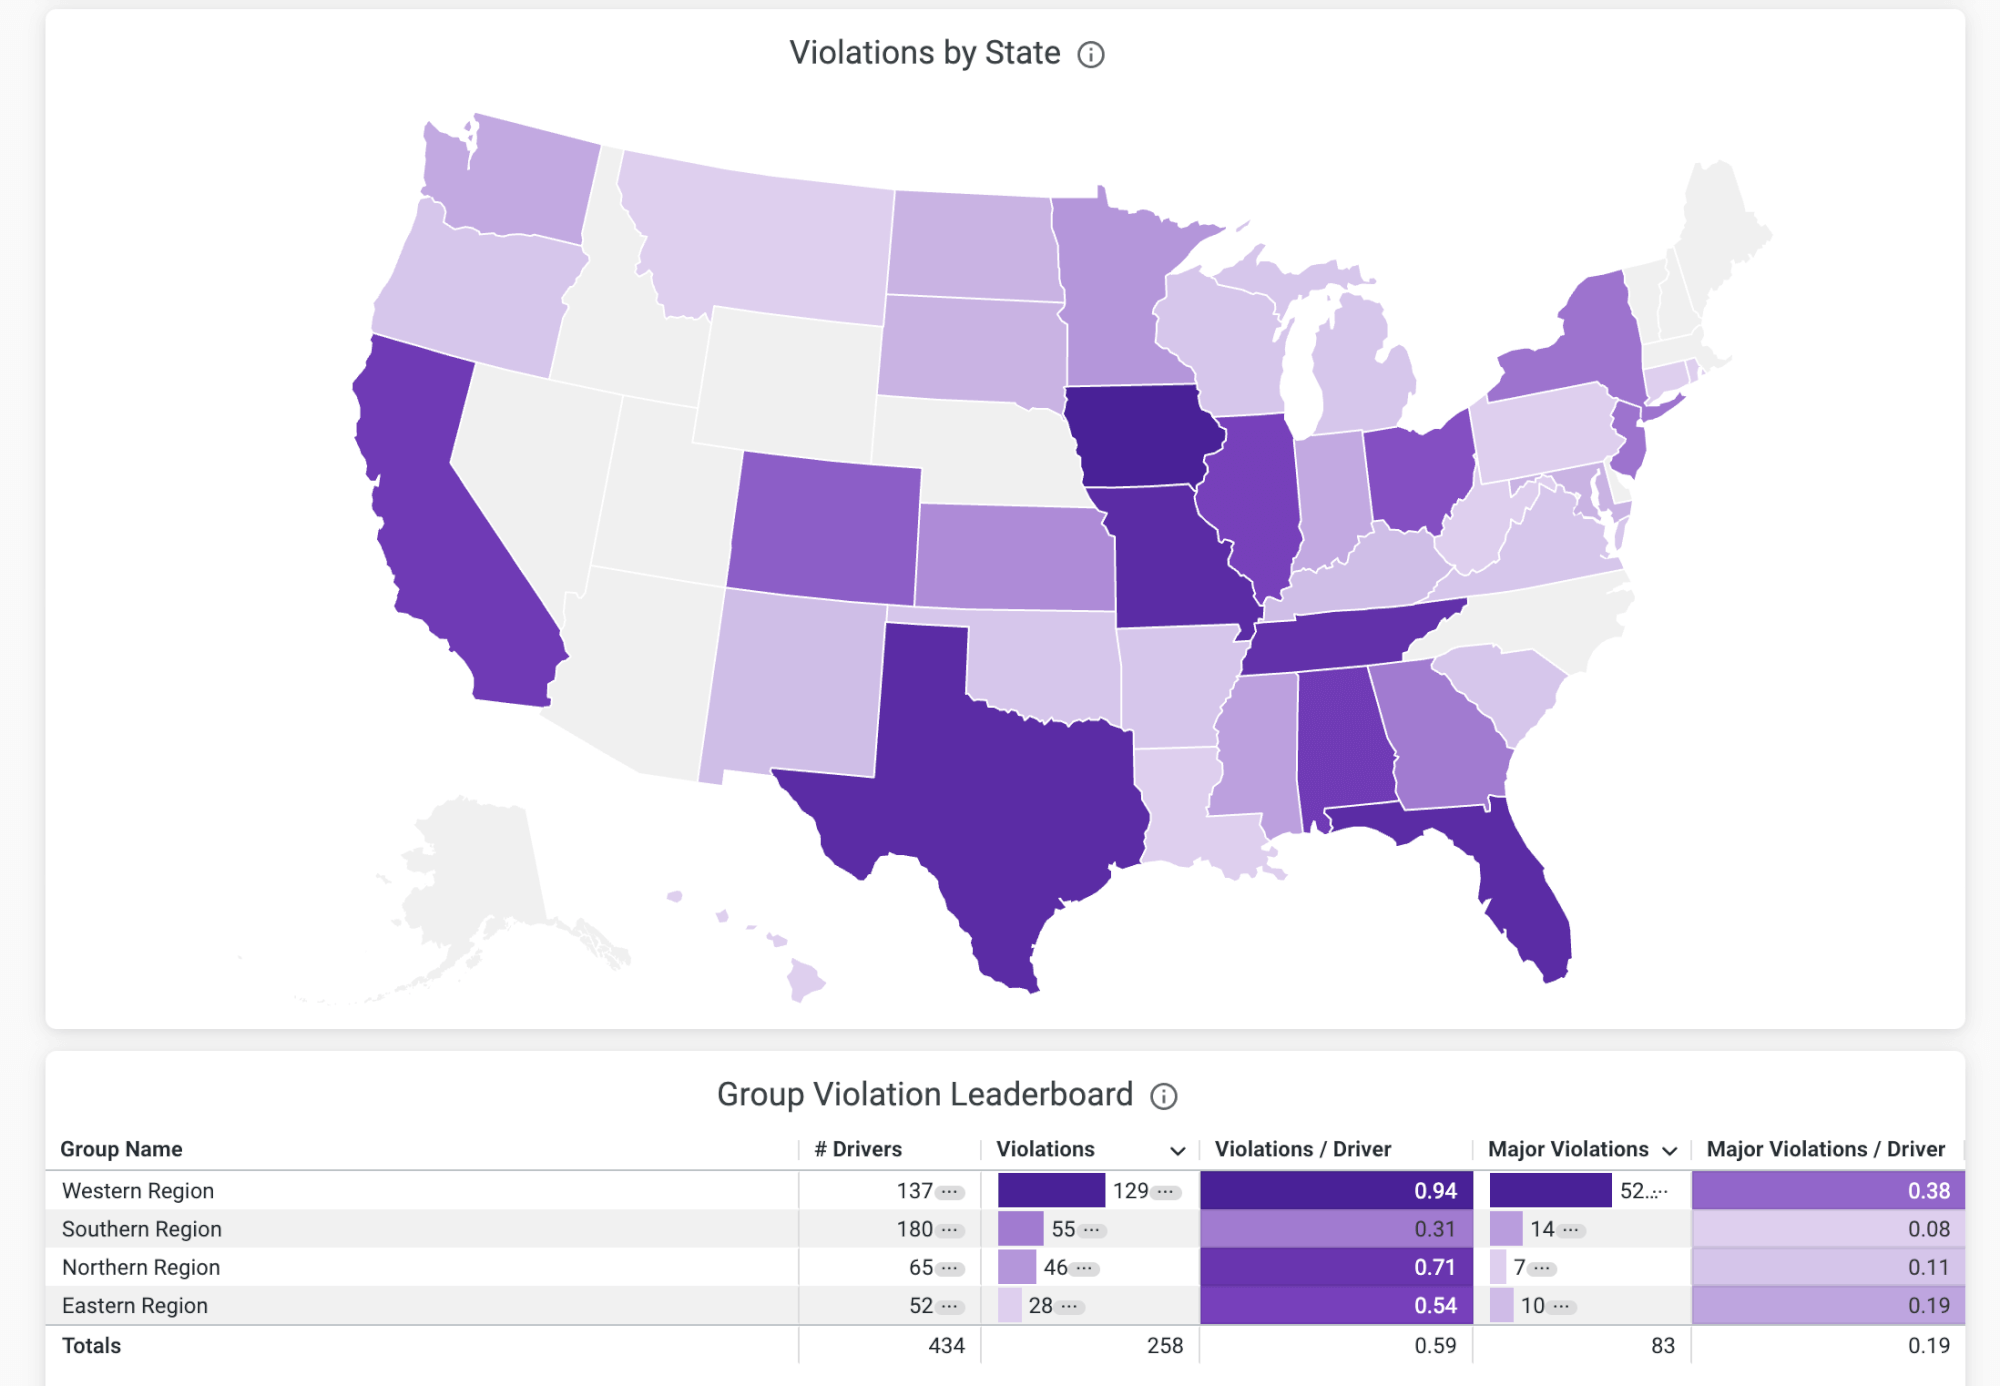
Pinpoint Risk by Groups or Location
“Where is my risk concentrated?”

The Group Leaderboard lets you see which of the groups are responsible for the different parts of your risk. The table can be stack ranked (or reversed!) on any of the data points, and it’s color-coded to show you risk at a glance. And like most things in Insight, you can simply click it to unearth the data beneath.
Hot tip: SambaSafety allows you to group your driver pool however you want, with groups and multiple levels of sub-groups. However your company’s org chart is set up, you can mirror it with groups. This is a powerful tool, and your SambaSafety team would love to help you set it up.
Once you dive into the violation or crash dashboards, you can also prioritize interventions by state. For example, your Northern Group manager notices that her team has multiple violations in the southeast corridor — it’s unusual enough that she investigates.
Uncover Violation Trends
“What are our most common violations?”

Another way to address risk is by looking for commonalities around violations. Some violations are a leading indicator of future crashes.
Insight makes easy to find:
- Your top 10 most common violations
- The major categories of violations
- The number of violations by state
- The groups that have the most violations
And, of course, Insight wouldn’t be much use if it didn’t let you fix the problem — you’re just a click away from getting a driver list. From there, you can pop into the driver profile to assign training that’ll change their behavior.
The Risk Multiplier: License Status
“What’s causing drivers’ licenses to be invalid?”

Analysis by insurers shows that license status is a big risk multiplier. The story behind it? Not knowing you have a driver with an invalid license can lead to punitive damages and negligent entrustment in the event of a crash— “how could you let someone behind the wheel who had a suspended license?!?”
Insight makes it simple to dig into your trends around licenses that are not valid. For example, setting an alert for any time the cause of an invalid license is a DUI.
Take Action on Risk with Training
Now that you know where the risk is, what are you going to do about it?

While charts and reports are useful for reducing risk in the organization, it’s at the individual level where safety happens. Insight lets you drill all the way down to lists of drivers. And with that list, you can assign and schedule individual training from SambaSafety. That helps you change those behaviors that led to the violation and short-circuit the problems that can lead to future violations.
Let Insight Come to You
Even risk professionals like you enjoy a weekend every so often. But you know who never sleeps? Software. So Insight makes it simple to create ever-watchful alerts that are triggered when a metric goes into a zone you don’t want. Which metric? Pretty much all of them. In the same way that nearly every chart, graph and number is clickable, you can set alerts on nearly anything.
So whether you’re looking at an average claim cost going above $10,000, or even just the number of invalid licenses being greater than 1, the flexibility in alerts will help you know you won’t face any surprises on Monday morning.
Insight also lets you be proactive — make sure that your boss at the mothership gets a PDF report about, for example, your team’s violation count on the first of the month. Just create the report, then schedule it to be delivered whenever you want.
You can also get super granular. Create reports for each of your branch managers that only show the drivers they’re responsible for. Help your team be more productive, improve accountability and prevent bottlenecks.
Turn Information Overload Into Actionable Insights
As you can tell from the length of this article, we’re pretty excited about this new feature.
Schedule a custom demo below and see how easy it is to uncover valuable insights buried in your driver data.