
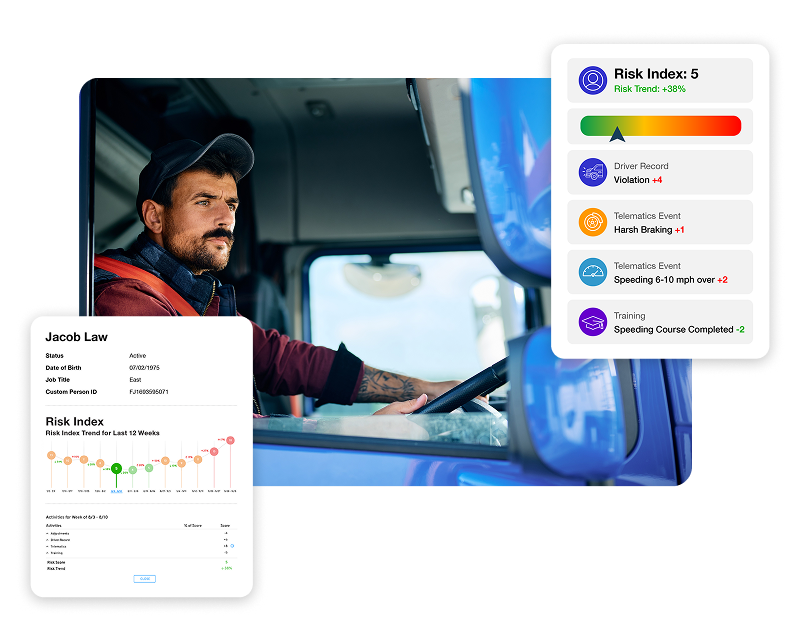
Achieve a Unified View of Risk
SambaSafety aligns data from disparate sources into a trackable Risk Index, giving fleet managers and insurers the confidence to implement a data-backed risk management strategy.
- Easily Quantify Risk
- Identify Contributory Factors
- Track Improvement
Access a Single Reference Point for a Better Understanding of Fleet Risk
Simplify fleet safety analytics and access a quick summary of risk with our intuitive and highly accurate scoring model – the Risk Index.

By combining licence validity and endorsements, claims history, employee profiles and normalised telematics data into a single score, the Risk Index offers a focused snapshot of driver risk. Configure metrics to align with fleet policies and aims, establishing a benchmark Risk Index for your fleet.
The Risk Index enables insurers to create a robust system for consistent and repeatable fleet insurance assessment.
Simple Answers to Your Most Challenging Questions
Consolidate driver risk data into a single score, allowing easy analysis and tracking of risk.
Get the True Picture of Risk
The Risk Index provides a consolidated, holistic view of a fleet's risk-related data. You can configure the weighting of metrics towards those of greatest importance, receive alerts when those metrics exceed set thresholds and easily quantify risk for stakeholders.
- Track Risk Trends
- Forecast Incident Rates
- Assess Insurance Risk


Identify Contributory Factors
Pinpoint exposure with deeper insights into how incidents, claims, license status and driver behaviour affect risk. Our dashboards reveal where driver risk is concentrated – by groups, locations, specific behaviours or drivers – to effectively address systemic problems where targeted intervention can achieve the greatest impact on risk. Example insights include:
- Heatmapping of Risk Sources
- Risk Areas by Category
- Driver Leaderboards
Quantify Your Safety Culture
Measure and report on the effectiveness of your fleet risk management and safety programme, with full visibility into risk trends over time. Assess drivers’ engagement with eLearning resources and measure the impact on your risk trends. You can even determine how often users access the SambaSafety platform, and how swiftly they respond to new information. You can track:
- High Priority Alerts Received and Closed
- Driver Training Assigned and Completed
- Daily Driver Counts

Why Advanced Scoring and Analytics Matter
40%
of crash-related costs are caused by 10% of drivers
19%
of fatalities involve drivers with an invalid license
26%
of fatalities involve speeding
Advanced Fleet Risk Insights for Every Type of Business
Learn How We Help Customers Transform Fleet Risk Management
“SambaSafety gives us powerful tools for identifying important trends and the overall health of our fleet. The system is easy to use and gives us an additional layer of information that actually improves company safety."

Department of Transportation Clerk
Wagner Equipment Co.