More driver data is better and a lack of it can effectively reduce risk mitigation efforts. When statisticians and data scientists are exploring in search of wisdom, they will tell you that the more data you have on a topic, the better your results will be. Whether it’s demographic data, consumer preferences, sports statistics, election polling or safety analytics, experts in any discipline are always looking for means of collecting more and better data to support their findings.
The SambaSafety Data Science team’s mission is to find ways to better understand what driver behaviors lead to the likelihood of future crashes. One of the ways in which they are finding correlations is by understanding Crash and Claims data, and the story it tells about driver behavior.
A lot of information on driver behavior can be gathered through State and Federal law enforcement databases, on-board telematics, camera systems and a growing ecosystem of data-driven safety technology. All of these driver data sources can tell us a lot about behavior; excessive speed, distraction, fatigue, aggressive driving, and more can all be collected relatively easily. The challenge is to connect those behaviors to the undesirable outcome: a crash. This has been a specific challenge in trucking because the crash data available is limited to the DOT Recordable Crash available from FMCSA.
Download Now: Revolutionize Your Approach to Mitigating Driver Risk
Most Drivers Never Have a DOT Recordable Crash
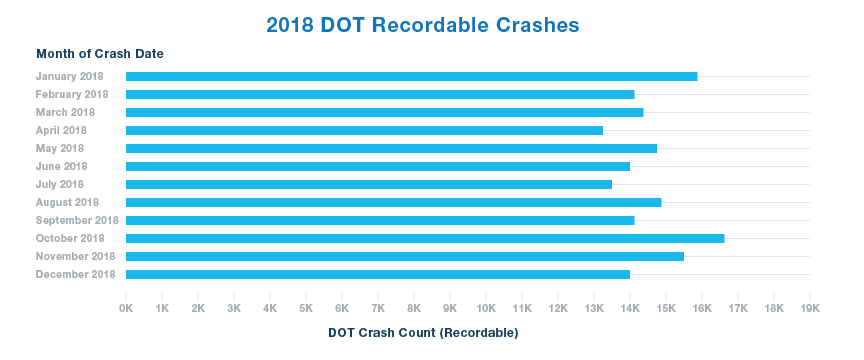
In 2018, there were 180,829 DOT Recordable Crashes entered into the MCMIS database maintained by FMCSA. That same year, the trucking industry recorded approximately 400 Billion Vehicle Miles Travelled. Statistically speaking, the DOT Recordable Crash Rate of .450 Recordable Crashes per Million Vehicle Miles Travelled illustrates that the DOT Crash is a very rare event. If you factor in that more than 80% of those are the fault of the other vehicle, you can see the challenge in using the DOT Crash rate as the basis for data science that strives to identify driver behavior that leads to crashes. Simply put, there’s not enough data.
SambaSafety has been busy collecting non-DOT crash and insurance claims data from a group of motor carrier customers over the course of the past year. We’ve seen between 10 and 15 non-DOT Crashes/Claims for each DOT Recordable Crash. With those claims, we now have, conservatively, 10 times the data to work with. Our data scientists have been dissecting that data to supplement the DOT Crash data in order to further determine how we correlate driver behavior to undesirable outcomes.
A Revolutionary New Feature
Last month, a new Crash & Claims Scoring feature was released as a standard offering on our Qorta platform. Qorta is the platform that combines SambaSafety’s MVR and the CSA data and compiles Driver Risk Scores based on those critical data elements. Now, all of our Qorta customers can upload their non-DOT Crash and Insurance Claims data into their account, and receive a composite score, for each driver. The composite score now can include all of the undesirable outcomes captured in Crash & Claims data.
If you would like to learn how data can transform driver risk management when paired with continuous monitoring, download our free guide below.