
Our 2026 Telematics Report is a long read, and I read it front to back, twice. I have spent more than 30 years in fleet operations, logistics, and risk management, including leading multi-state logistics networks and telematics programs. I read this report the way I used to read vendor data: looking for what I would change on Monday morning.
Across those years, one gap showed up again and again. Fleets collect telematics data, but far fewer turn it into coaching, root cause fixes, and trends leadership can read. Closing that gap starts with a repeatable routine.
Telematics improves fleet safety when you act on the data, not just collect it. The programs that work follow four steps: focus on speeding and distraction, coach drivers quickly, find the root cause behind repeated events, and track whether those events fall over time.
Key Takeaways
- Build your driving policy around speeding and distraction, and compare drivers on events per mile.
- Few fleets use telematics data to assign training, and those that do report better results.
- Coach within 48 hours, and match the response to the cause: coaching, training, or progressive discipline.
- Before blaming a driver for repeated events, check the route, schedule, and site.
- Track a few metrics weekly, including how many flagged drivers were coached and how many kept their commitments.
Speeding dominates the data, so build your policy around it
When I ran fleets, two behaviors kept me up at night: speeding and distraction. The 2026 Telematics Report supports that instinct. Nearly three-quarters (73%) of all driving events in SambaSafety’s telematics data relate to speeding. Both behaviors deserve your attention no matter how many vehicles you run, but the problem looks different depending on your size.
If you run a small fleet, the problem is time. You are the safety manager, the dispatcher, and sometimes the person who fixes the printer. Speeding and distraction events land in your inbox every day. Finding the hour to act on them before they become a citation or a crash is the hardest part of the job.
If you run a large fleet, the problem is volume. You have more data than any person can read. It took me years to accept that safety comes from the actions you take on the data, however much of it you collect.
Structure fixes both problems. Start by writing the policy your data will enforce. Put speed management and distraction first, whether your fleet is regulated or not, and treat the posted limit as a ceiling, not a target.
For distraction, be specific about mobile devices. Name the approved uses, such as navigation, dispatch, electronic logging, and delivery confirmation. Require drivers to launch approved apps before the trip starts. Prohibit handheld use while the vehicle is moving. If anything needs attention beyond hands-free or voice-guided use, drivers should stop in a safe, lawful place first. Without a clear standard, every event becomes a judgment call, and judgment calls do not scale.
Then read the data fairly. Compare drivers on events per mile driven, not raw counts, so your highest-mileage drivers do not look riskiest just because they drive the most. The report uses the same logic for its industry benchmarks.
Ask this week
Which 10% of your drivers produced most of last month’s severe speeding events? Has anyone talked to them yet?
Few fleets use telematics for training, and those that do report better results
The report’s training numbers show the gap between collecting data and acting on it. Only 26% of fleets use telematics data to assign driver training. Among fleets that pair the two, 78% report fewer crashes or claims.
If you have telematics, you have an advantage. An MVR tells you what already happened: the citation, the conviction, the suspension. Telematics shows you the hard brake, the 22 mph over on the frontage road, and the phone in hand at a red light, before any of it reaches a record. Both give you a chance to intervene before a crash or claim, and telematics gives you that chance sooner.
Waiting is expensive in two ways. First, you risk losing the driver. Repeated behavior eventually produces violations that put the driver outside your safety policy, and you lose someone you spent months recruiting and training. Second, you take the hit to the bottom line: crash and claim costs, verdicts, lost workdays, bad press, and higher premiums at renewal.
Every fleet manager I know has opened a telematics dashboard on a Monday morning, seen a few hundred alerts, and closed the laptop. Fixing that takes two things: a way to find the high-risk events in the noise, and a way to act on them quickly with coaching and training.
Make sure the data deserves your trust
Before I coach anyone, I check four things:
-
-
- Devices reporting consistently
- Miles attributed to the right driver
- Alerts producing documented action
- Exceptions closed on time
-
If any one of them is red, fix it first. A conversation built on bad data makes the next one harder. Attribution matters most. When drivers skip logins or share vehicles under a default driver, unassigned miles pile up. From there, the pattern is predictable: login discipline slips, unattributed events grow, and risk scores lose accuracy. Then the team stops trusting the data, and the program gets abandoned even though the scorecard still looks active. The cheapest place to stop it is at the first sign of slipping logins. I aim for more than 95% of miles attributed to the right driver.
Surface the events that matter
Telematics devices generate thousands of alerts, and no one can read all of them. Look for a tool that pulls telematics data from the devices you already run, surfaces high-risk incidents and trips with context, and shows them next to MVR and CSA information. SambaSafety does this across more than 100 telematics service providers, so your week starts with the events that need a decision.
When several issues compete for the same week, rank them on four questions:
- How severe is it?
- How often is it happening?
- Can you realistically prevent it?
- How much effort will the fix take?
A driver with three speeding events in 48 hours will usually outrank a slow slide in attribution, because the speeding is severe, repeating, and fixable this week.
Coach quickly, and match the response to the cause
In my experience, 48 hours from a flagged event is the right window for a coaching conversation. It keeps the event fresh, shows drivers that safety is a consistent priority, and creates a clear rhythm for follow-up. I use a five-step conversation:
-
-
- Prepare: Confirm the data and the pattern.
- Open: Ask a neutral question before you show the scorecard.
- Explore: Find out what is driving the behavior.
- Commit: Get a specific agreement the driver states out loud.
- Document: Record it.
-
The Explore step decides what happens next. If the driver knows the expectation and can meet it, that is coaching. If the driver does not know how to handle a specific situation, that is a capability gap, and assigned training does its best work there. If the driver made a documented commitment and did not keep it, that is progressive discipline. Matching the response to the cause keeps training from feeling like punishment.
An effective fleet safety policy pairs the standard with a progressive discipline framework. It says explicitly that minor telematics threshold exceedances usually warrant coaching rather than formal discipline. Early intervention keeps a correctable behavior in the coaching lane, where you keep the driver, instead of the discipline lane, where you may lose them.
Every conversation gets the same five-element record: date, specific events, root cause, the driver’s commitment, and the review date. “Coaching completed” is not a record. On a large fleet, this is workflow design: set response deadlines by severity, route flagged drivers to a supervisor queue, and audit consistency across supervisors and sites.
Run it on a weekly rhythm
I tie all of this to a Weekly Safety Rhythm: a Monday snapshot, action Tuesday through Thursday, and a Friday follow-up.
- Monday snapshot (15 to 30 minutes): Review weekend incidents and alerts, check your scorecard, and triage drivers as green, yellow, or red. Name your top three priorities and assign an owner to each by the end of the morning.
- Tuesday through Thursday, action: Coach drivers within 48 hours of flagged events, close exceptions such as unassigned miles, and fix device and attribution issues. Regulated fleets also close hours-of-service and DVIR exceptions.
- Friday follow-up (30 to 45 minutes): Check whether behavior changed, close open items or escalate blockers, update the scorecard, and prepare a short weekly summary for your team.
Weekends need awareness, not a full review. Scan the incident queue on Sunday, and have an on-call response ready if a threshold event occurs. For a small fleet, the Monday snapshot is the protected time that keeps speeding and distraction from slipping to the bottom of the pile.
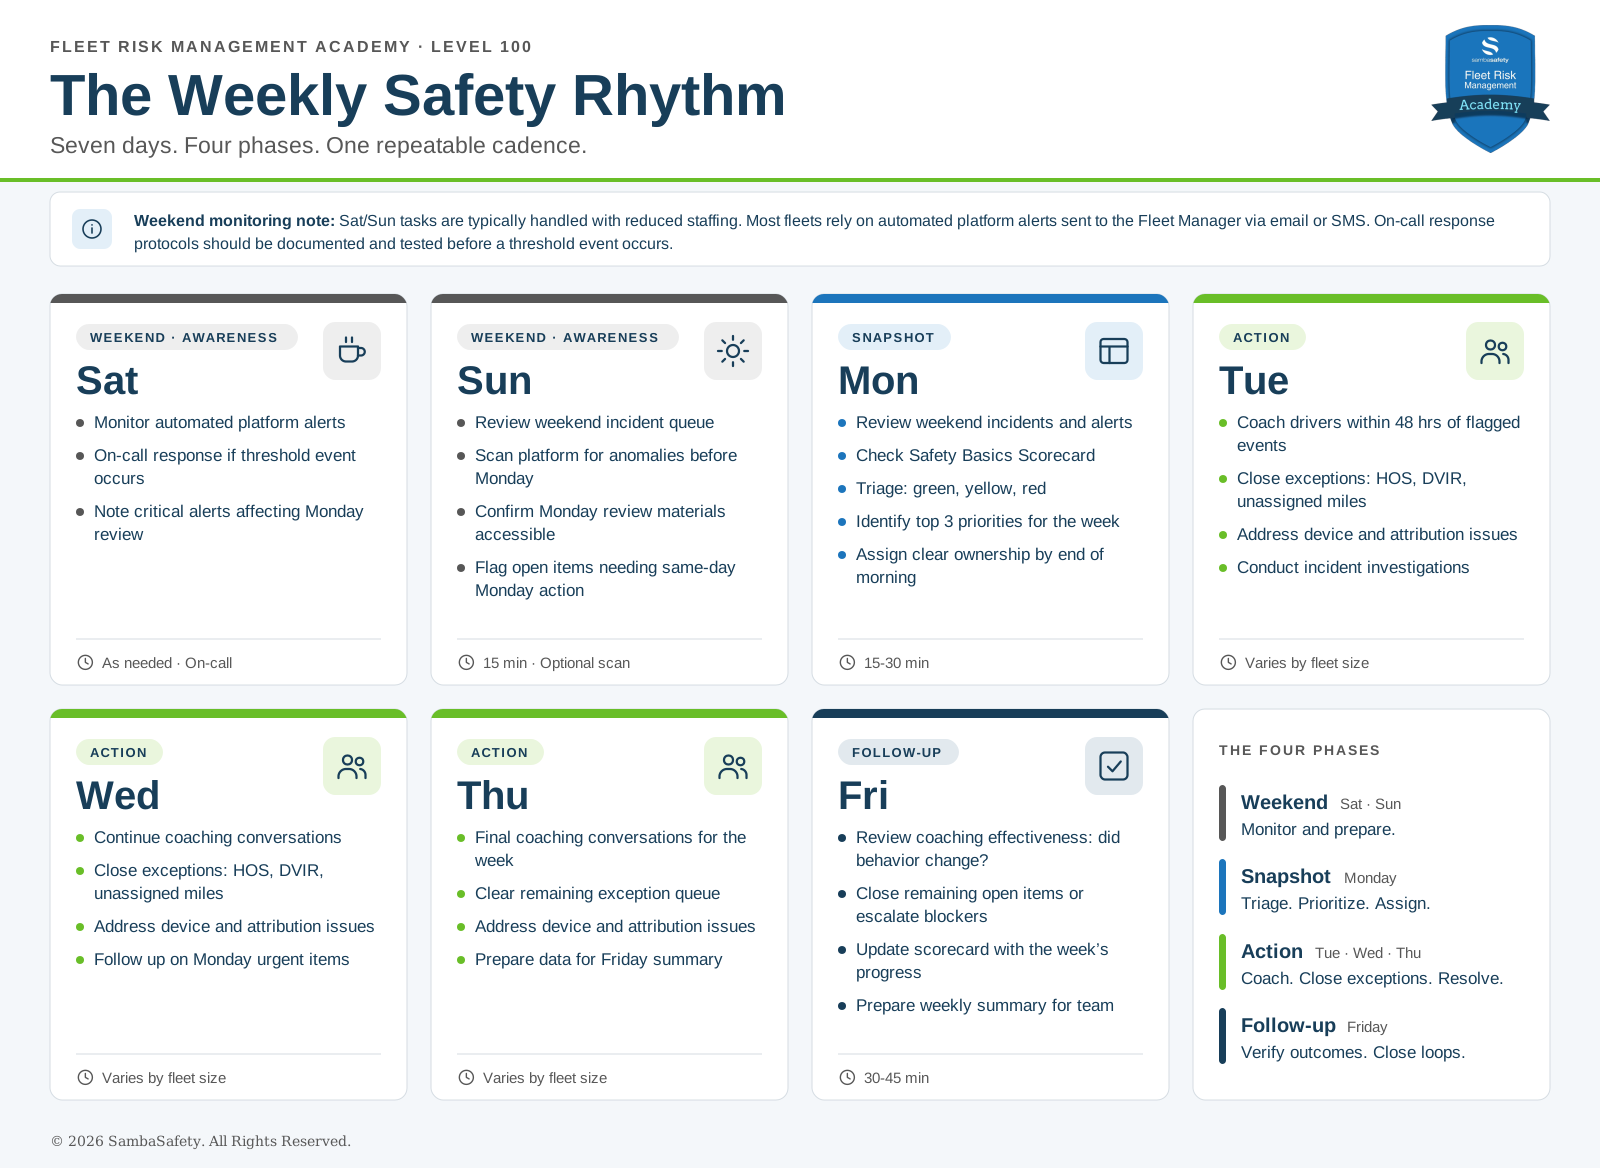
Build a rhythm that fits your fleet. Time on the action days varies with fleet size and industry, so a fixed schedule rarely fits. The free Level 100 course in SambaSafety's Fleet Risk Management Academy, which I helped develop, covers safety program basics and includes a customizable Weekly Safety Rhythm tool you can adapt to your own operation. The course is open to anyone, and no SambaSafety account is required.
Ask this week
When a driver triggers a severe speeding event on a Tuesday, how many hours pass before someone talks to them? What percentage of last week’s alerts led to a documented conversation or action?
Repeated events often trace back to the route or schedule
Early in my career, I coached the same driver three times for speeding on the same morning route. On the fourth event, I rode the route at the time he drove it. The first delivery window could not be met at the speed limit in normal traffic. I had been coaching a scheduling problem.
The report’s timing data points the same direction. Severe speeding runs 21% above its all-day average in the morning, and 42% of distracted driving events happen between 6:00 and 11:59 a.m. My colleague, Jim Angel, Telematics Safety Advisor at SambaSafety, notes in the report that morning speeding may signal traffic delays, unrealistic delivery windows, or too little time built into routes. He adds that an operational adjustment may work better than a punitive one, and that harsh braking and aggressive turning often drop when fleets reduce speed.
Industry differences raise the same question: is it the drivers or the operation? Construction fleets post a median of 254 severe speeding events per 100,000 miles, more than five times Transportation and Warehousing at 48. Some of that gap may be behavior. Some may be thresholds, job-site travel, and crew-driven schedules. Construction and field service fleets told SambaSafety that generic thresholds built for highway trucks flag routine site maneuvers as risky.
Coaching fixes one driver at a time. Root cause analysis fixes the conditions behind many drivers’ events. Read the shape of the pattern before you talk to anyone:
- Events concentrated on one road segment, time window, or location: The cause is probably environmental: the route, the schedule, the equipment, or the site.
- One driver’s events spread across every route, day, and time: The cause is probably behavioral.
Getting that call right fixes the problem and shows drivers you read the data fairly.
Check five patterns every time: the driver, the route, compliance, training, and seasonality. Then add the vehicle to the picture. A driver with recurring hard braking and a vehicle with recurring brake defects is one problem, not two. If you run a regulated fleet, pull the inspection and DVIR history before you schedule the coaching conversation. When a cluster shows up across depots, shifts, or routes, give it an owner in operations as well as safety, and track whether the fix reduced events.
Ask this week
Pull last month’s morning severe speeding events and sort them by route. If the same route shows up across several drivers, is that a driver problem?
A few metrics reviewed consistently beat a dozen reviewed sporadically
Coaching and root cause fixes only prove their value if you measure them. This is what separates a safety program from a safety project: high-risk events keep falling over a year, not just a month. That takes earlier intervention and root cause fixes.
The Friday follow-up in the Weekly Safety Rhythm closes the loop with one question: did behavior change? If it did, move to the next priority. If it did not, dig deeper or adjust.
Build a Minimum Viable Dashboard
A Minimum Viable Dashboard is the smallest set of metrics you will review every week, organized in three tiers:
- Tier 1, anchor metric: The primary risk signal for your fleet. It varies with your fleet's makeup and operational commitments
- Tier 2, supporting metrics: The behaviors that drive the anchor metric
- Tier 3, financial metrics: The numbers that translate the trend into cost
Here is a mature version of the dashboard we ran at my previous company:
- Our Tier 1 anchor metric was speeding
- Our Tier 2 supporting metrics were following too closely, harsh turns, and harsh braking
- For Tier 3, we tracked fuel efficiency, savings on unplanned maintenance, and crashes avoided
Defect closure rate is a useful addition because it shows the program covers the vehicle as well as the driver. It is the share of reported defects repaired and documented within your target window, such as 24 hours from work order receipt. A defect that stays open past that window, or is never documented, creates risk for your fleet.
Check that coaching is happening and sticking
Two more metrics tell you whether the program itself is working:
- Coaching coverage rate is the share of flagged drivers who received a coaching conversation within 48 hours, with a target of 95% or higher. In my experience, 95% is a strong standard. The remaining 5% leaves room to audit the event, confirm its severity, and let the data reach the right people before you coach.
- Commitment honor rate is the share of coached drivers who kept their commitment, with a target of 80% or higher. It shows whether coaching is sticking in the field.
If the same event keeps showing up for the same driver or group, look past the driver. The training may not fit the audience, your expectations may be unclear, or a condition on the route or at the site may be driving the behavior. If coverage is above 95% and your incident rate stays flat, check whether anyone follows up on the commitments.
Whatever tool you use should show trends without hours of manual work, compare drivers and groups on a normalized basis, and show which flagged drivers have been coached. A spreadsheet can start the job. SambaSafety's reporting covers much of this with 12-week Risk Index trends, benchmarking across drivers and business units, and a filter for drivers who have or have not received coaching or training. You still track follow-through metrics like commitment honor rate yourself.
Measure the culture, not just the numbers
Culture keeps this cycle running when you are busy, and I describe it in four words: consistency is the culture. A safety culture exists when every supervisor responds to the same event the same way, every time, because that response is expected, documented, and supported by leadership. Driver recognition matters as much as correction. The most mature fleets aim for three positive coaching interactions for every corrective one.
I use a Safety Maturity Model to measure the culture itself. Fleets move through three stages, and most start at stage one. What separates the stages is how quickly and how consistently you respond.
| Stage | What the fleet does | Culture | Typical timing |
|---|---|---|---|
| Stage 1: Reactive | Coaching happens after incidents, often weeks late, if it happens at all. | Reactive and blame-oriented | Where most fleets start |
| Stage 2: Proactive | The fleet coaches soon after flagged events and uses data to guide decisions. | Improving and data-led | Typically 3 to 6 months in |
| Stage 3: Predictive | Leaders use trends to adjust routes, schedules, and training before incidents occur, and improvement holds for a year or more. | Embedded, with recognition built in | Typically 12 to 18 months in |
Show leadership what the program is worth
On a large fleet, executives will want to know what the program changed and what it was worth. Hold recurring effectiveness reviews, and build a short ROI narrative from your trend data. A strong one has three parts: a clear baseline, the specific safety investment or operational change you made, and the measurable results that followed. Your Tier 3 financial metrics supply the numbers.
Then tie those results to business value: lower claims costs, avoided crash expenses, a stronger underwriting position, or greater operational resilience. That shows leaders why continued investment matters. I cover the ROI narrative in depth in Level 300 of our Fleet Risk Management Academy.
Ask this week
If your insurer asked tomorrow for a twelve-month trend of severe speeding and distraction events by driver, could you send it that afternoon?
See how your fleet compares
Once you can answer that question, the next one is how your numbers stack up. The 2026 Telematics Report breaks out speeding and distraction rates by industry and shows how fleets are using telematics data for training, so you can see where your program stands against your peers.