Telematics devices can generate thousands of safety alerts a day. A hard stop at a loading dock and a driver texting at highway speed can land in the same queue. Treating them alike wastes time and buries the events that matter most.
Sorting fleet telematics data by risk gives safety teams a clear place to start. Everything from texting to idling shows up in the data, and each event calls for a different level of response.
Key Takeaways
- Fleet telematics data spans five areas, from location and driving behavior to driver status and engine health.
- Texting, severe speeding, and drowsy driving carry the highest risk and warrant the fastest response.
- Medium-risk events such as harsh braking need a set plan for when and how managers respond.
- Avoidable idling and noncritical engine faults carry little crash risk, but they add up to fuel and wear costs over time.
- Telematics is a leading indicator, and acting on it early can prevent crashes and claims that raise insurance costs.
What Driver Telematics Data Covers
Nearly 90% of fleets now use telematics, according to SambaSafety’s 2026 Telematics Report. Many fleets run more than one provider. Among Enterprise fleets (1,000 or more vehicles), 38% use two or more telematics service providers, compared with 27% of all fleets. Each added provider means another stream of data to sort.
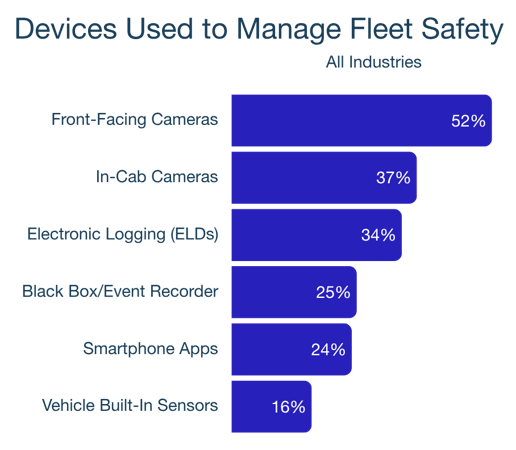
Across providers, fleet telematics data falls into five groups:
- Location and routing, from GPS devices: where vehicles are, where they have been, and how long trips and stops last.
- Driving behavior, from GPS devices: speed, hard braking, rapid acceleration, and cornering.
- Driver status, from cameras: phone use, drowsiness, and other signs of distraction.
- Vehicle health and fuel, from engine connections: engine fault codes, idling, and fuel use.
- Hours and compliance, from electronic logging devices (ELDs): hours-of-service status.
A single fleet telematics system rarely captures all five groups, so a fleet’s device mix determines what it can see.
Which Telematics Data Carries the Most Risk
Crash research does not rank telematics events equally. Some behaviors show up in far more crashes and near-crashes than others. These levels guide triage. They are not a formal score, and the studies behind them measure different outcomes.
| Risk Level | Telematics Data Point | Why It Ranks Here |
|---|---|---|
| High | Texting and dialing | An FMCSA-funded study of commercial drivers found that texting made the odds of a safety-critical event, such as a crash or near-crash, 23.2 times greater. Dialing a cell phone made them 5.9 times greater. |
| High | Severe speeding | SambaSafety defines severe speeding as going 21 mph or more over the posted limit, or above 85 mph. SambaSafety’s 2026 Driver Risk Report found that 21 to 25 mph over in a 60 mph zone carried an 82.2% increased probability of a claim within 12 months. |
| High | Drowsy driving | NHTSA-published research found about 20% of crashes and near-crashes among short-haul truck drivers involved drowsiness. |
| Medium | Minor and moderate speeding | IIHS research shows speed affects both the number of crashes and the severity of injuries. Our Driver Risk Report found speeding even 1 to 5 mph over the limit carried a 36.1% increased probability of a claim within 12 months. |
| Medium | Harsh braking and acceleration | An NHTSA-published study found that drivers with high crash and near-crash rates showed more hard braking, hard acceleration, and swerving in everyday driving. Travelers adds that hard braking can also signal distraction, speeding, or tailgating. |
Rank review by severity, repeat events, and context, not by level alone. Repeated medium-risk events may deserve faster review than an isolated, unverified high-risk alert. Treat the levels as a starting point, then set thresholds that match your safety policy.
Turning Driver Telematics Data Into Action
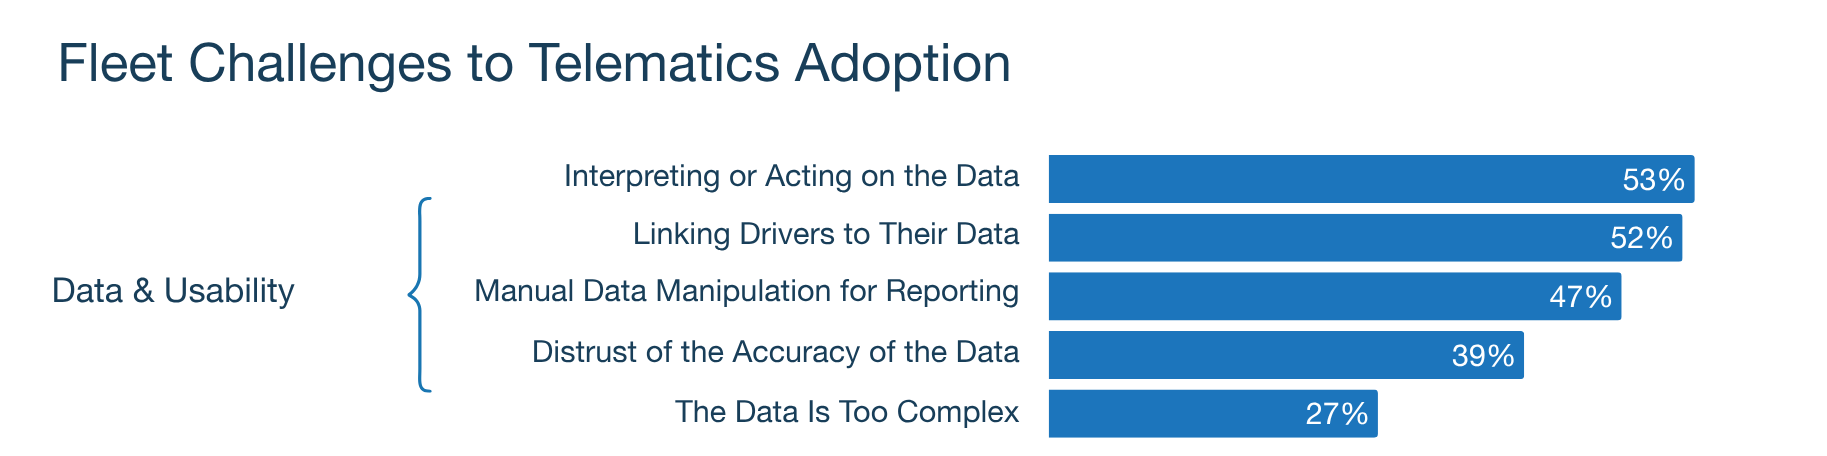
Transportation fleets use cameras and ELDs at rates well above the industry average. Even so, 61% cite interpreting or acting on their data as a difficulty, compared with 53% across all fleets. Gathering driver telematics data is the easy step. The hard step is deciding what to do with it.
Telematics is a leading indicator. It shows risky behavior before violations, crashes, and claims follow. Those outcomes drive insurance premiums and affect the bottom line. Acting on the early signal gives a fleet the chance to change them.
Check the Data Before You Act
A quiet dashboard is not proof of safe driving. No recorded events can also mean a behavior went undetected. Before prioritizing alerts, confirm that:
- Every device is reporting, and any gap has a known cause.
- Trips are fully covered.
- Detection settings match your safety policy.
A detection label is not a confirmed finding. A phone-use alert does not establish texting or dialing, and a drowsiness alert is not a medical conclusion. Review the available evidence and the operating context to confirm what happened.
Act Quickly on High-Risk Events
A texting alert or a severe speeding event should reach a manager fast. Assign a reviewer and a backup so no alert depends on one person. If a threat is still unfolding, follow your fleet’s escalation procedure first. The coaching conversation can come later. Suspected drowsiness may call for a safe stop and rest.
Avoid distracting a driver who is moving. Once the trip ends or the vehicle is parked, talk while the event is still fresh. Lead with support, not blame, since the goal is to help drivers stay safe and employed. If the conversation points to a habit or skill gap, assign training that matches the behavior. A clear process for coaching drivers after high-risk events keeps responses consistent across managers.
Plan for Medium-Risk Events
Harsh braking needs a response plan, but not necessarily a same-day conversation. Review the context and driver’s account: a hard stop may have avoided a hazard. If an unsafe behavior or skill gap is confirmed, promptly assign matching training, such as a defensive driving course. Coaching can follow within a day or two unless immediate action is needed. The goal is safer decisions, not fewer alerts, so drivers should never feel they must avoid braking hard when a hazard demands it.
Track Routine Events That Add Up
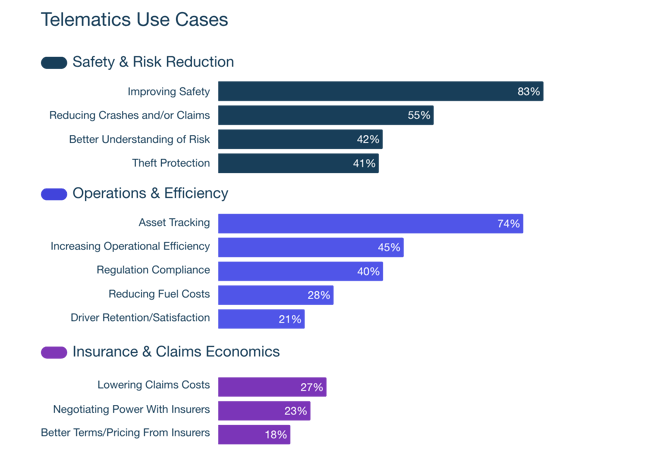
Telematics shows more than crash risk. Avoidable idling and noncritical engine faults add up to fuel and wear costs across the fleet. Reducing fuel costs is a telematics use case for 28% of fleets, according to SambaSafety’s 2026 Telematics Report. Not every fault code is minor. Urgency depends on the specific fault and the vehicle’s service guidance, so serious faults need prompt attention. Review routine events on a regular schedule and step in when a pattern appears. Some idling is required by the work or conditions, so judge patterns in that context. Coaching on speeding and harsh acceleration also helps improve fleet fuel efficiency.
Putting Fleet Telematics Data to Work
A single view of telematics events, MVR violations, and CSA incidents makes it easier to see which drivers need attention. SambaSafety integrates with more than 100 telematics service providers to build that view without replacing the devices a fleet already uses.
Collecting driver telematics data does not reduce risk on its own. Our Knowing Isn’t Fixing guide explains how to build an intervention plan around the driver data you already collect.