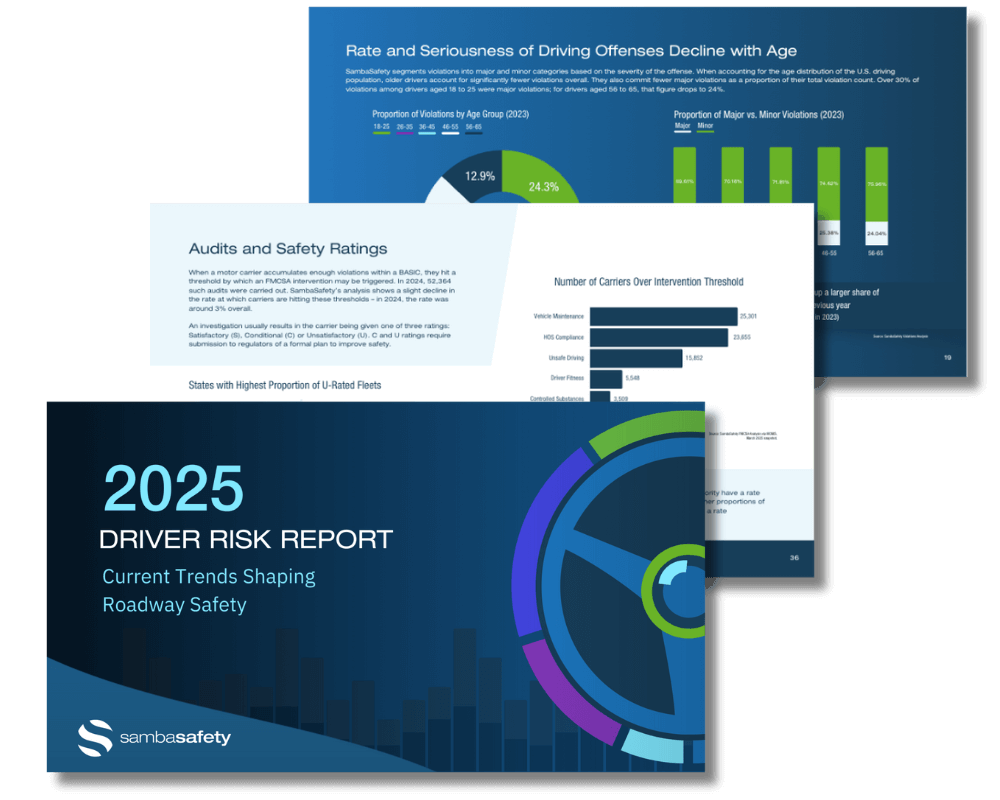
Hear from Rich Lacey, SambaSafety’s Executive Vice President, Product Management as he answers all questions surrounding the expedited launch of the Performance Dashboard.

QUESTION (Q): What is the Performance Dashboard?

Rich Lacey (RL): For a long time, our customers have been hungry for more data. After implementing a driver safety program, they want to be able to measure its impact. The Performance Dashboard was created for exactly that, allowing risk and safety professionals to measure the impact their driver monitoring program has on driver behavior.

Q: Why did you decide to launch these features now?

RL: Our product, engineering and data science teams have been working on analytics for the last year and a half. We have shared the results directly with select customers over the last year and the response has been overwhelming. In light of recent events, we know that process optimization and cost reduction are at the forefront of everyone’s mind. To that end, we felt that providing every customer with the ability to access high-level trends and benchmarks could be very impactful.

Download Now: Revolutionize Your Approach to Mitigating Driver Risk

Q: Who is the Performance Dashboard for?

RL: The Performance Dashboard was designed for safety and risk professionals responsible for overall safety programs. That said, any Qorta user will find value in the Performance Dashboard. The ability to plot violation trends, compare your performance to industry peers and drill into organization or specific group violation categories is very powerful and kind of fun.

Q: Why is the Performance Dashboard different than anything SambaSafety has previously done?

RL: Historically, we’ve provided operational reports that have allowed our users to quickly find the individual or group of individuals that they are looking for.  The Performance Dashboard is different, as it provides a higher-level overview of trends across dozens, hundreds or even thousands of drivers. When viewed from this, level interesting and important trends emerge.

Q: Is there anything like this product in the continuous driver monitoring marketplace?

RL: We have not seen anybody in the driver monitoring marketplace provide anything like the Performance Dashboard. I think that’s why our customers reacted so enthusiastically over the last 18 months when we shared our internal analytics during business reviews. It’s also one of the main reasons we were excited to expedite the release and get it in customer hands as soon as possible. We have many more data and analytics innovations in the pipeline for later this year.

Q: What can the Performance Dashboard tell me?

RL: One of the most interesting discoveries we made during our testing was that our Performance Dashboard was an excellent measuring stick for a comprehensive driver safety policy made up of many different components. Our larger customers made investments in training, telematics, incentive programs and cameras. After all these investments, those customers lacked a single method for measuring the impact of all the aforementioned technology.

Working with dozens of large customers, we are able to see the impact of their investments in the Performance Dashboard. At the end of the day, everything you do to improve safety will result in drivers with fewer violations, proper credentials and licensing, all leading to the most important outcome – fewer crashes. Continuous monitoring is ideally positioned to observe all these trends independent of the technology that drives them.

Q: What about Performance Dashboard can better help me manage my risk?

RL: Two words: speed and simplicity. Any user can log-in and start reviewing trends immediately. No complicated software to learn, connections to configure or data to track down. No calls to IT, spreadsheet downloads and no need to google how to create an Excel pivot table. I have yet to meet a customer who tells me how much they love to create their own reports in Excel. Instead, it’s all there in a simple-to-use dashboard.

Q: How would I know if the Performance Dashboard is impactful over time?

RL: That’s the best thing about the Performance Dashboard – it gets better with more data. The longer you are monitoring drivers, the more interesting the trends  become. We are confident that the Performance Dashboard will become one of your go-to tools you review on a weekly and monthly basis.

Q: What do you think is the most valuable feature?

RL: It depends on your objective. If you’re focused on automatically enforcing your safety policy, then by far it’s the policy score breakdown, easily identifying who is and is not compliant with your safety policy as well as those trending in the wrong direction.

If you’re focused on optimizing your safety policy, it’s the trend, graph and violation breakdowns. This is where you’ll start to identify the behaviors you need to get on top of, whether through education, incentives or training. One thing I am confident about is that every customer will find something they can’t live without in the Performance Dashboard.


About Rich Lacey

As Executive Vice President, Product Management, Rich Lacey directs and oversees SambaSafety’s product strategy, development and implementation of new solutions. Lacey brings over 20 years of experience in product and architecture development as well as product management for industry-leading technology companies.

To learn more about how continuous monitoring transforms driver risk management, download our white paper.